
An Overview of Car Accident Statistics for Los Angeles, California
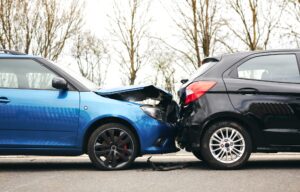 The University of California, Berkeley tracks collision data for the entire state through the Transportation Injury Mapping System (TIMS), which draws on the SWITRS. Every figure in the database reflects a wreck that hurt or killed someone, since crashes causing only property damage are excluded.
Law enforcement agencies across the state feed their collision reports into the system, which makes it the most complete public record of who gets hurt on California roads. The records break down by road user, including pedestrians, bicyclists, and motorcyclists, and by cause, such as drunk driving.
These numbers highlight both city and county totals, because greater Los Angeles extends far past the city line.
Injury-Causing Los Angeles Car Accident Statistics
Los Angeles sees tens of thousands of people injured in car crashes each year, more than any other California city. Combining the three SWITRS injury levels with fatalities, TIMS reports the following totals for people hurt or killed in Los Angeles collisions:
- 2021: City: 18,658 | County: 41,460
- 2022: City: 16,226 | County: 40,449
- 2023: City: 15,605 | County: 38,733
- 2024: City: 16,876 | County: 42,727
- 2025: City: 16,484 | County: 40,041
Averaged out, roughly 45 people are hurt or killed within city limits every single day, and about 110 across the county. The yearly totals dipped through 2023, rebounded in 2024, and eased again in 2025.
How Many Car Accidents in Los Angeles Are Fatal?
Traffic accidents in Los Angeles are responsible for hundreds of fatalities. The statistics for fatal car accidents in Los Angeles are as follows:
- 2021: City: 388 | County: 798
- 2022: City: 368 | County: 818
- 2023: City: 343 | County: 755
- 2024: City: 313 | County: 715
- 2025: City: 324 | County: 613
City deaths fell 19% from 2021 through 2024 before ticking back up in 2025. Countywide deaths dropped 23% over the same five years, a real improvement that still leaves hundreds of families grieving annually.
Speed, impairment, and the region’s wide, fast arterial roads keep the toll from falling faster. Wrongful death claims give surviving family members a civil path to accountability that runs separately from any criminal case.
Traffic Accidents Involving Motorcycles in Los Angeles, CA
Motorcycle collisions are increasingly common in California, considering the state has the most registered motorcycles out of any other state in the country. Riders hurt or killed in Los Angeles collisions total:
- 2021: City: 976 | County: 2,760
- 2022: City: 924 | County: 2,825
- 2023: City: 877 | County: 2,824
- 2024: City: 894 | County: 2,912
- 2025: City: 1,036 | County: 2,890
On average, two to three motorcyclists are injured or killed each day within the city of Los Angeles and nearly eight each day across Los Angeles County. Because motorcycles offer no protective frame, airbags, or seatbelts, even a moderate-speed collision can result in catastrophic injuries.
How Many Accidents Involve Bicyclists in Los Angeles?
Hundreds of bicyclists are struck within city limits every year, and countywide totals run near 2,000 in most years. Los Angeles car accident statistics for cyclists hurt or killed in a collision show the following:
- 2021: City: 523 | County: 1,820
- 2022: City: 463 | County: 2,000
- 2023: City: 385 | County: 1,893
- 2024: City: 445 | County: 2,219
- 2025: City: 526 | County: 2,167
Bicycle crash totals in Los Angeles reached their lowest point in 2023 before increasing by more than 35% by 2025. In March 2024, voters approved Healthy Streets L.A. (Measure HLA), which requires the city to add bicycle and bus lanes as streets on its mobility plan are repaved.
Because those improvements will take years to complete, cyclists throughout Los Angeles continue to face significant risks.
Pedestrian Traffic Accident Statistics for Los Angeles, California
Walking is the most dangerous way to get around Los Angeles. Drivers must yield to people in marked and unmarked crosswalks under California Vehicle Code § 21950, yet TIMS logs thousands of pedestrian victims each year:
- 2021: City: 1,591 | County: 3,760
- 2022: City: 1,459 | County: 3,691
- 2023: City: 1,419 | County: 3,764
- 2024: City: 1,581 | County: 4,065
- 2025: City: 1,575 | County: 3,625
County pedestrian totals peaked at 4,065 in 2024 before easing, while city figures have remained consistent. The city launched its Vision Zero program in 2015 with the goal of eliminating traffic deaths by 2025, and the numbers above show how far away that goal remains.
People on foot absorb the full force of any impact, which is why these cases so often involve life-altering injuries.
Los Angeles DUI Car Accident Statistics
Impaired driving continues to injure thousands of Angelenos annually, despite decades of enforcement campaigns and public awareness efforts. Alcohol-involved collisions affecting drivers, passengers, motorcyclists, bicyclists, and pedestrians total:
- 2021: City: 2,683 | County: 6,617
- 2022: City: 2,321 | County: 6,072
- 2023: City: 2,164 | County: 5,976
- 2024: City: 2,333 | County: 6,239
- 2025: City: 2,115 | County: 5,504
City totals fell about 21% across the five years, although a 2024 rebound interrupted the decline. Driving under the influence of alcohol or drugs violates California Vehicle Code § 23152, and a criminal conviction on that charge doubles as powerful evidence in your civil injury case. Specifically, a DUI finding makes it very hard for an insurer to argue that its policyholder drove reasonably.
How Many Car Accidents in Los Angeles Are Hit-and-Runs?
SWITRS recorded 34,220 hit-and-run collisions in Los Angeles over this five-year span. Los Angeles car accident statistics surrounding those hit-and-run accidents include:
- 47,895 injuries
- 980 fatalities
- 2,874 involving motorcycle riders
- 4,325 including pedestrians
- 1,364 involving bicyclists
Averaged out, that means almost 19 hit-and-run collisions every day and nearly 200 deaths every year. Leaving an injury crash scene is a crime under California Vehicle Code § 20001, punishable as a felony when someone is seriously hurt or killed.
Fleeing compounds the original negligence, and it frequently leaves injured people chasing compensation from a driver nobody can find. Our Los Angeles car accident lawyers help hit-and-run victims recover their losses.
If a Los Angeles crash left you injured, our attorneys can review your options at no cost. Call M&Y Personal Injury Lawyers at 866-864-5477 for a free consultation.
What Are the Primary Causes of Los Angeles Car Accidents?
Speeding causes more Los Angeles wrecks than anything else, contributing 44.8% of injury- and fatality-related collisions. Every SWITRS record names a primary collision factor, meaning the single violation most responsible for the crash, and speed sits atop that list year after year. Other common causes include:
- Distracted driving
- Drunk driving
- Drug-impaired driving
- Following too closely
- Improper passing
- Unsafe lane changes
- Ignoring traffic signals and signs
- Improper turning
- Driving on the wrong side of the road
- Hazardous parking
Nearly all of these behaviors break a specific rule of the road. Speeding, for example, violates the basic speed law in California Vehicle Code § 22350, which prohibits driving faster than conditions safely allow.
Pinpointing the primary collision factor usually identifies the liable party, which is why our team secures the police report, camera footage, and witness statements early.
How M&Y Personal Injury Lawyers Can Help After a Car Accident in Los Angeles, CA
Our firm has served injured people across Southern California since 2013, from our main office on Wilshire Boulevard to our Downtown location on South Figueroa Street, and these Los Angeles car accident statistics explain why our phones never stop ringing.
At M&Y Personal Injury Lawyers, our Los Angeles car accident lawyers have more than 100 years of cumulative experience helping injury victims in Southern California, and over 1,400 five-star reviews. Our personal injury law firm has recovered more than $800 million in compensation for our clients. Results may vary. Prior case outcomes do not guarantee similar results. If you hire M&Y Personal Injury Lawyers for help with your Los Angeles car accident claim, our attorneys:
- Investigate the collision to determine causation and liability
- Negotiate with calculated insurance companies on your behalf while you concentrate on recovering
- Handle your claim from start to finish, keeping you updated at all times
- Monitor the applicable statute of limitations and timely file claims
- Argue your case in a Los Angeles County court if we fail to secure a fair out-of-court settlement for you
An attorney manages every case at our firm from beginning to end, rather than passing the work to a paralegal, and many of our clients come to us through referrals from former clients and fellow attorneys who know our results firsthand.
 Statistics tell part of the story, but every crash involves someone dealing with injuries, medical expenses, and the insurance claims process. At M&Y Personal Injury Lawyers, our Los Angeles car accident attorneys work to recover the full value of every car accident claim.
We bring courtroom experience and the resources to take a case as far as it needs to go. You can count on our insight and preparation at each stage.
Someone from our office answers the phone 24/7, and you will never be treated like just another file here, because your case becomes our top priority the moment it becomes yours.
We also take every case on contingency, so you pay nothing up front and owe nothing at all unless we win money for you. That arrangement removes the financial risk of hiring counsel at the exact moment an injury has already strained your budget.
Call M&Y Personal Injury Lawyers at 866-864-5477 for your free consultation today.